First grade math standards ask students to organize, represent, and interpret data with up to three categories; ask and answer questions about the total number of data points, how many in each category, and how many more or less are in one category than in another. CCSS.MATH.CONTENT.1.MD.C.4
Recently, I visited a first grade class where we worked on some graphing and data fun using Google Sheets!

We started by taking a whole-class poll through a Google Form, through which we learned that CHOCOLATE was the favorite flavor. The students each used their Chromebook to vote on the form, which had been posted in their Google Classroom.


The students were excited to see their results instantly! Because they had voted, the data was meaningful and relevant to them! We had a discussion to dive into the results just a little deeper. We discussed a friend who was absent, and what the implications for the data would be depending on his vote. “What if Miguel voted for….?”
Next, I modeled how to enter our ice cream data into this spreadsheet template that is already set up to show results as both a bar graph and a pie chart. I showed how I could enter our vote totals into each of the cells, and how the charts adjusted automatically. Modeling is essential when working with little learners. They CAN do it! It just takes practice!


Once I had modeled the process, we shared the template to Google Classroom. First the students replicated the model by using our class ice cream data. Then we started experimenting with the numbers. For example, I asked, “What if 100 people voted for chocolate? Predict how that graphs will change.” This kiddos enjoyed playing with the numbers and watching the data adjust on the graphs. This allowed them to further develop number sense as they witnessed that bigger numbers make the graphs grow larger.
Now YOU try it!
Pairs of students were tasked to develop a unique question to ask their peers. Some examples of the questions they created:
- What is your favorite pet?
- What is your favorite Pokemon Character?
- Which is your favorite Superhero?
ELA Standards, including writing and speaking, were reinforced in this Math activity, as students had to develop their own questions and ask them aloud to their classmates.
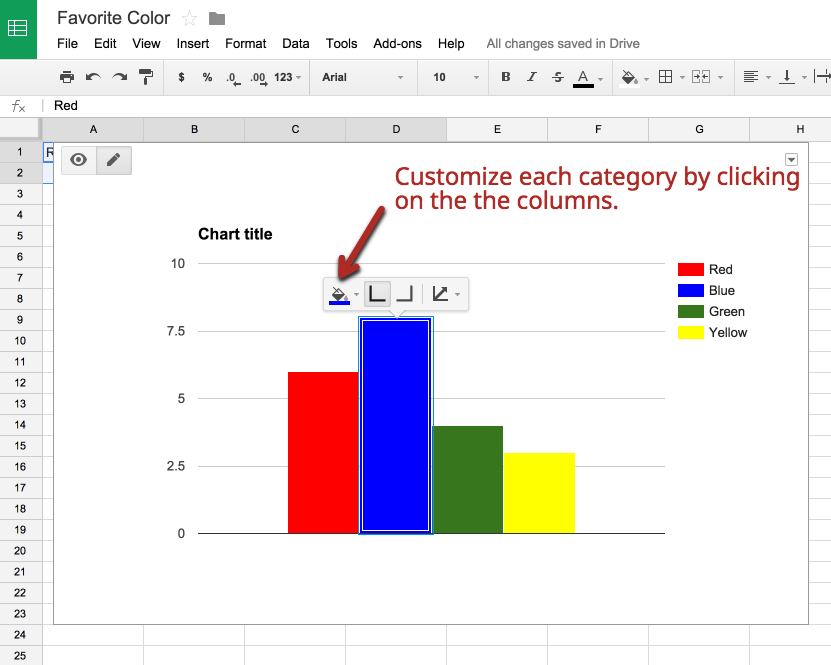
Once we had all voted on each other’s survey, the students entered the data they collected and created their own using templates linked in their Google Classroom. Because they are naturally curious, it didn’t take long for the students to click around to customize colors and other settings in their charts.


The kids had so much fun. The math conversations were amazing! I can’t wait to see what else these little learners will do with spreadsheets as they continue to develop their skills.
Tips for Little Learners:
Tips for Little Learners:
- Don’t hesitate to use proper spreadsheet vocabulary, including “rows”, “columns”, and “cells.”
- Model, model, model!
- Use Google Classroom to distribute the templates.
- Pair students up as necessary to maximize success for all!
The links below will create your OWN copy of the templates we used. Feel free to use, modify, and share!