The Second Grade Common Core Math standards ask students to create picture and bar graphs to represent data sets with up to four categories. (CCSS MATH 2.MD.D.10)
Drawing bar graphs is plenty fun, but we decided to kick it up a notch and create some bar graphs in Google Spreadsheets!

We started with a simple question from the whole class:
What is your favorite color?
All students voted by hand and then we worked together to make a bar graph of the results on the Promethean board.
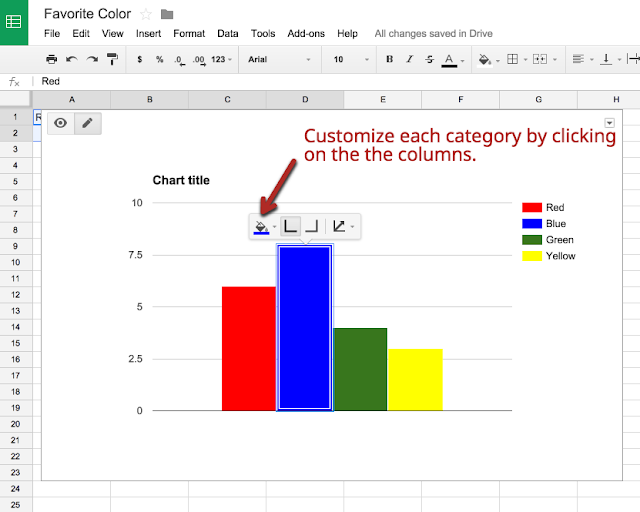
The students then logged into their Chromebooks and used the same data to create a graph on their own spreadsheet.
Here are the steps for creating a bar graph in Google Spreadsheets:

So that was all fun, but now it was time to go even further! Students each wrote their own survey question and then created a one-question Google Form to collect their data. They pasted their form links into a Google Classroom announcement so all students could fill out each others' forms. After, they used their survey data to create individual bar graphs in Google Spreadsheets.
The students learned so much! And guess what? They wanted to repeat this project over and over again. Oh darn, the students want to take surveys and make graphs to represent data. I suppose we can let them!
So many people are terrified of spreadsheets, but this project proved that everyone has to start somewhere, and why not in second grade?!?! By giving students a relevant purpose and some basic guidance through the tools, they can accomplish amazing things!
Even our youngest students can create using Google!


No comments:
Post a Comment